
Side project
SEO and marketing dashboard
Perchscope
Rankings, technical checks, traffic estimates, and open tasks for a group of websites, collected every day and shown in one dashboard behind a team login
Who it's for: Marketing and SEO teams who look after several websites and want one place to see what moved and what to do next.

- automatic data run
- Daily
- recovery for deleted tasks
- 30 days
- a login session lasts
- 14 days
- export for Excel
- CSV
What Perchscope does
Rankings
Rankings and history
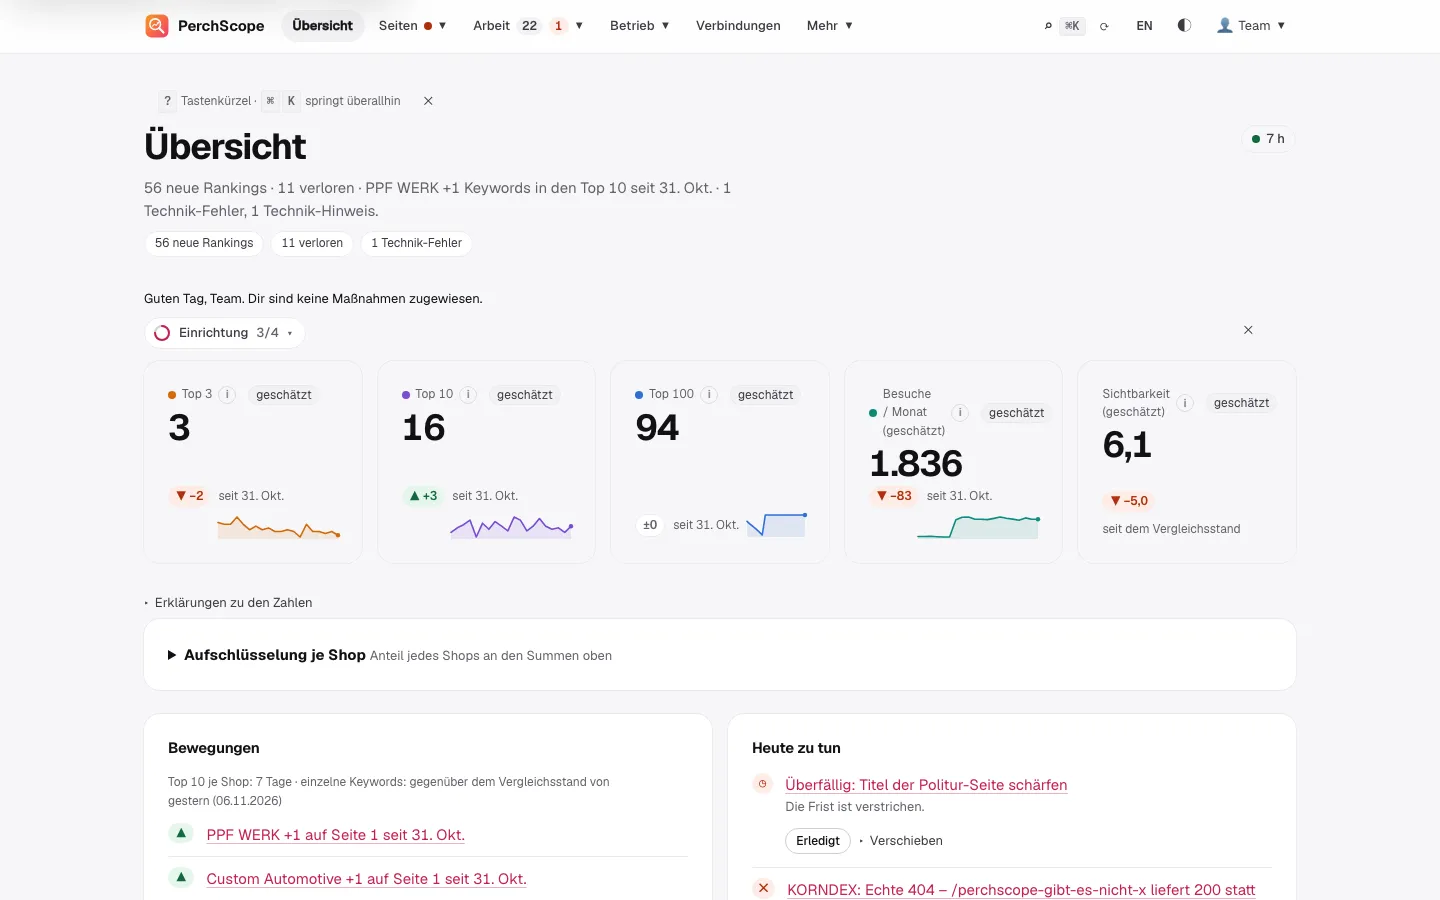
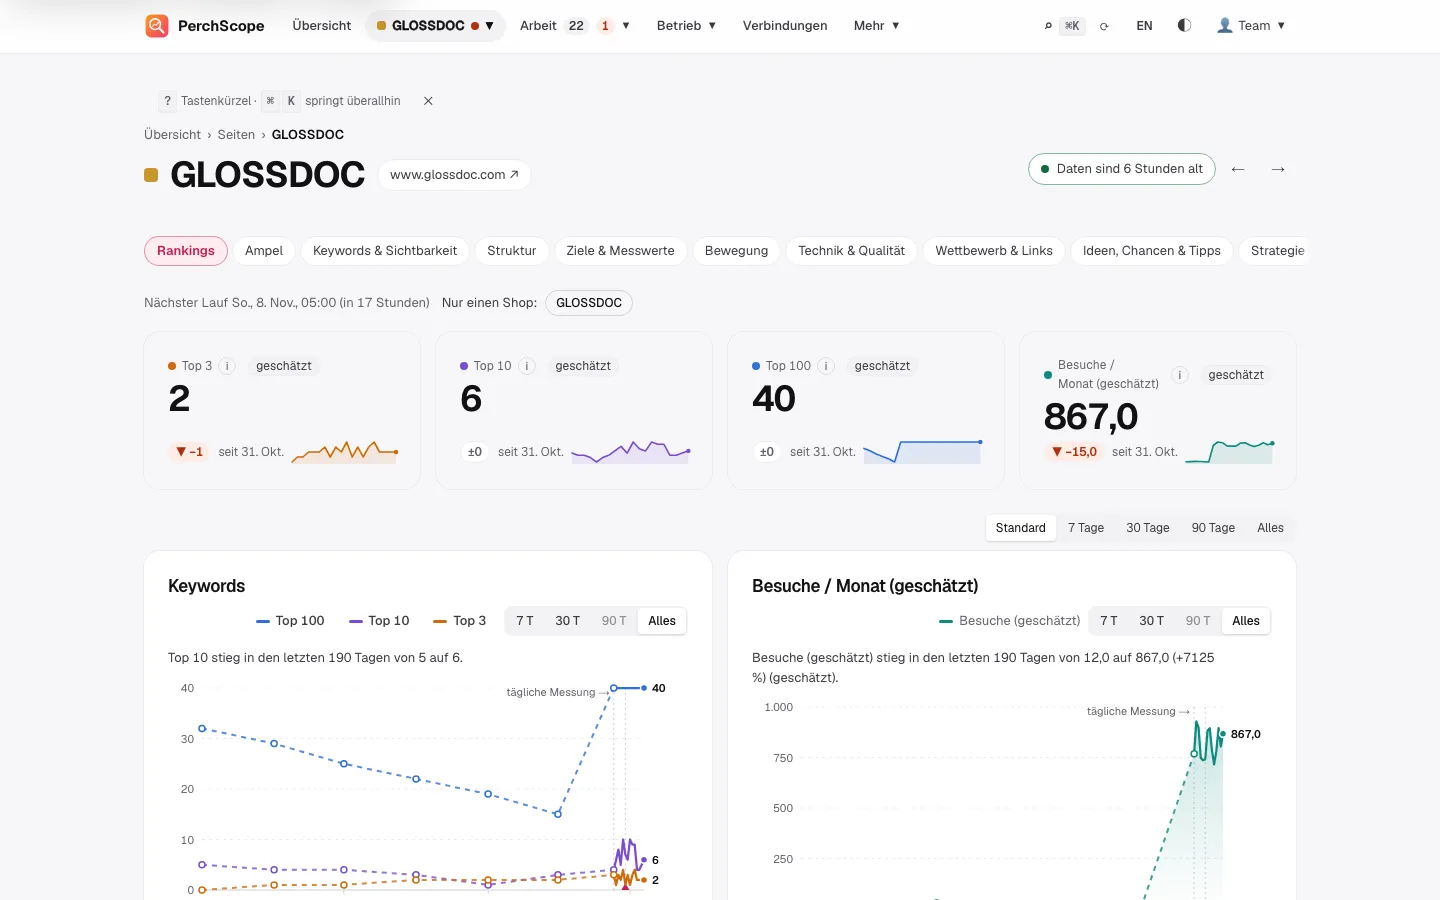
Keywords in the top 3, top 10, and top 100 per website, with the change since the last comparison and the winners and losers.
One keyword over time
The position day by day, the URL that ranks and when it switched, the season, and the search result page.
Competitors and gaps
Competitors per website, the keywords they rank for and you do not, and opportunities by cluster and by page length.
Site health
Technical checks
Errors and notes for each website, so a page that returns an error does not wait to be noticed in the rankings.
Search Console figures
Clicks and impressions from Search Console, when you connect it. Without it the page says so instead of showing zero.
Pull requests and deployments
Open pull requests and recent deployments from GitHub beside the numbers, so a ranking move has a date to compare against.
Marketing
Marketing and traffic
Estimated organic traffic per website, campaigns with UTM tags, conversions, and the state of every data source.
Instagram per brand
Profile, recent posts, and drafts for each brand, read from the Graph API. Perchscope only reads.
Reports
A weekly or monthly report on one page that prints cleanly as a PDF.
Running it as a team
Task list
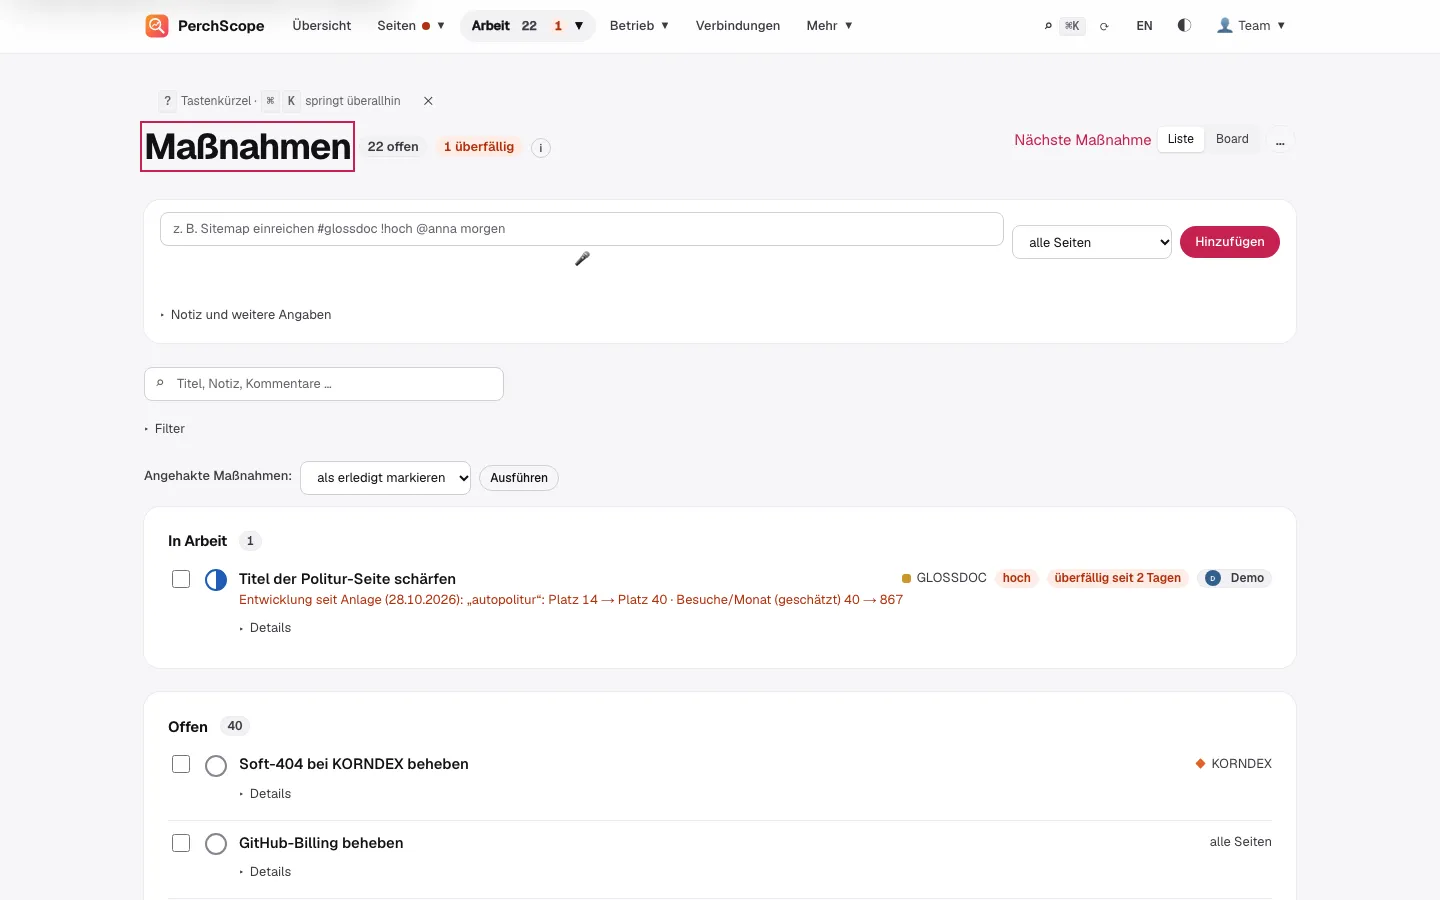
Tasks with priority, due date, owner, link, and comments, and the effect since a task was created when it came from a tip.
Runs and costs
What each data run cost, a forecast for the month, and a button to start a run in the background.
Export and API
CSV for Excel, an OpenAPI description, and an MCP interface for tools that read the same figures.
How it works
Connect the sources
Ranking data, Search Console, GitHub, and Instagram, each added when you are ready.
A run every day
The data is collected automatically and kept as a history, so a change always has a before.
Read the overview
What moved, what was lost, what broke, and what is due today, on one page.
Act and track
Turn a tip into a task, and see later what it did for the numbers.
A closer look
Questions about Perchscope
Who can sign in?
Only people your team has given access. Everything except the start page, the legal notice, and the privacy policy sits behind a login.
Are the visit numbers real?
They are estimates from rankings and search volume, and the dashboard marks them as estimated. A dash means not measured, never zero.
Where does the data come from?
Daily ranking data from DataForSEO, optional figures from Search Console, and pull requests and deployments from GitHub.
Can I take the numbers elsewhere?
Yes. Every table exports as CSV for Excel, the report prints as a PDF, and there is an API for anything else.
Want to see Perchscope at work?
Start on www.perchscope.pro, or talk to us about what it could do for your team.